
Tamil Nadu Election Results 2026 provide complete details on winners, seat count, voter turnout, and constituency-wise performance across all parties. This page includes full election data, district-level statistics, and key insights to help users understand the results clearly.
In addition, the page covers voter turnout trends, party-wise competition, and demographic insights across Tamil Nadu. Users can explore detailed breakdowns including elector distribution, candidate statistics, and regional variations in participation.
Tamil Nadu Assembly Election 2026
தமிழ்நாடு சட்டமன்ற தேர்தல் முடிவுகள்
* Final results based on official count
| Party | Won | Leading | Total |
|---|---|---|---|
Tamilaga Vettri KazhagamTVK |
108 | 0 | 108 |
Dravida Munnetra KazhagamDMK |
59 | 0 | 59 |
All India Anna Dravida Munnetra KazhagamADMK |
47 | 0 | 47 |
Indian National CongressINC |
5 | 0 | 5 |
Pattali Makkal KatchiPMK |
4 | 0 | 4 |
Indian Union Muslim LeagueIUML |
2 | 0 | 2 |
Communist Party of IndiaCPI |
2 | 0 | 2 |
Viduthalai Chiruthaigal KatchiVCK |
2 | 0 | 2 |
Communist Party of India (Marxist)CPI(M) |
2 | 0 | 2 |
Bharatiya Janata PartyBJP |
1 | 0 | 1 |
Desiya Murpokku Dravida KazhagamDMDK |
1 | 0 | 1 |
Amma Makkal Munnettra KazagamAMMK |
1 | 0 | 1 |
| Total | 234 | 0 | 234 |
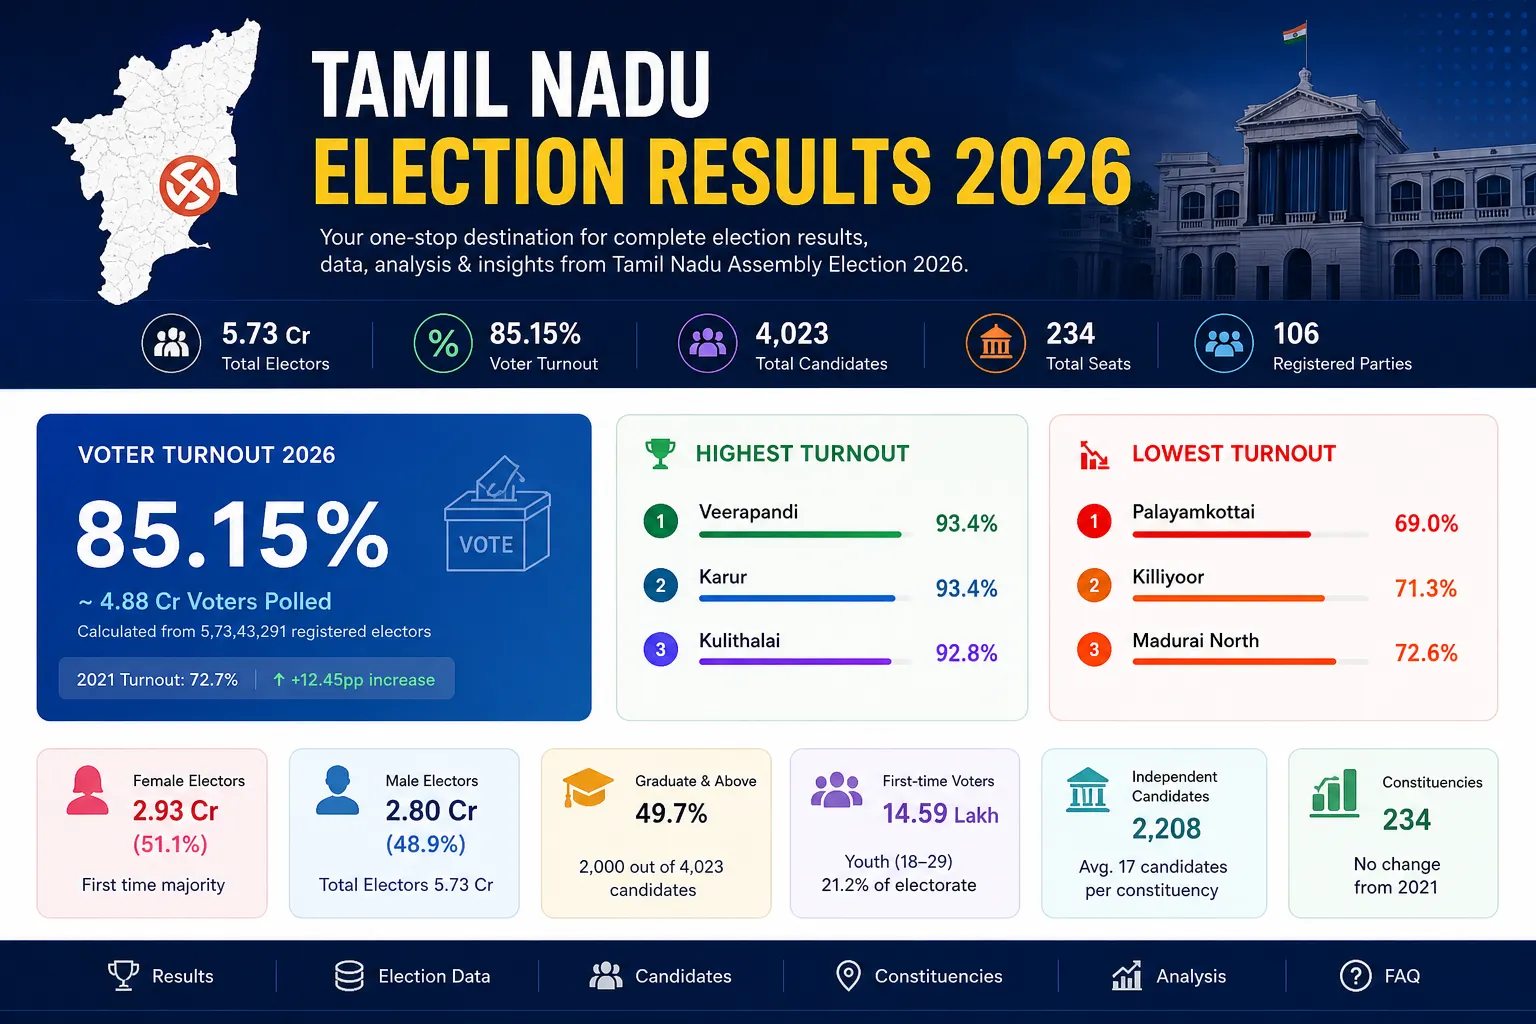
Tamil Nadu Election 2026 — At A Glance
Key statistics from the 2026 Tamil Nadu Assembly Election
Voter Turnout — 2026
Approximate turnout calculated from 5,73,43,291 registered electors
Elector Statistics — 2026
Voter registration and demographic breakdown
* Electors count is based on final roll as on 27/03/2026
District-wise Elector Data
All 38 districts — complete voter registration breakdown
* Final electoral roll as on 27/03/2026 | ACs = Assembly Constituencies
| # | District | ACs | Total Electors | Male | Female | Third Gender |
|---|---|---|---|---|---|---|
| 1 | Thiruvallur | 10 | 32,10,213 | 15,69,312 | 16,40,283 | 618 |
| 2 | Chennai | 16 | 28,93,505 | 13,95,716 | 14,96,921 | 868 |
| 3 | Kancheepuram | 4 | 12,07,757 | 5,85,274 | 6,22,279 | 204 |
| 4 | Vellore | 5 | 11,48,847 | 5,56,783 | 5,91,899 | 165 |
| 5 | Krishnagiri | 6 | 15,69,141 | 7,83,351 | 7,85,524 | 266 |
| 6 | Dharmapuri | 5 | 12,52,019 | 6,29,980 | 6,21,887 | 152 |
| 7 | Tiruvannamalai | 8 | 19,34,582 | 9,50,689 | 9,83,736 | 157 |
| 8 | Viluppuram | 7 | 15,98,762 | 7,88,677 | 8,09,870 | 215 |
| 9 | Salem | 11 | 27,80,356 | 13,82,049 | 13,97,983 | 324 |
| 10 | Namakkal | 6 | 13,23,753 | 6,41,118 | 6,82,427 | 208 |
| 11 | Erode | 8 | 17,59,157 | 8,47,197 | 9,11,778 | 182 |
| 12 | The Nilgiris | 3 | 5,52,006 | 2,63,603 | 2,88,377 | 26 |
| 13 | Coimbatore | 10 | 27,44,472 | 13,22,759 | 14,21,179 | 534 |
| 14 | Dindigul | 7 | 16,89,822 | 8,20,907 | 8,68,740 | 175 |
| 15 | Karur | 4 | 8,51,690 | 4,08,941 | 4,42,668 | 81 |
| 16 | Tiruchirappalli | 9 | 21,47,051 | 10,40,900 | 11,05,841 | 310 |
| 17 | Perambalur | 2 | 5,58,761 | 2,73,255 | 2,85,474 | 32 |
| 18 | Cuddalore | 9 | 20,34,971 | 9,99,968 | 10,34,704 | 299 |
| 19 | Nagapattinam | 3 | 5,32,680 | 2,61,714 | 2,70,936 | 30 |
| 20 | Thiruvarur | 4 | 9,88,734 | 4,84,548 | 5,04,135 | 51 |
| 21 | Thanjavur | 8 | 19,68,724 | 9,55,150 | 10,13,417 | 157 |
| 22 | Pudukkottai | 6 | 13,09,496 | 6,45,813 | 6,63,613 | 70 |
| 23 | Sivaganga | 4 | 11,19,335 | 5,48,106 | 5,71,186 | 43 |
| 24 | Madurai | 10 | 24,96,190 | 12,22,309 | 12,73,616 | 265 |
| 25 | Theni | 4 | 10,41,539 | 5,06,058 | 5,35,303 | 178 |
| 26 | Virudhunagar | 7 | 15,09,518 | 7,34,350 | 7,74,921 | 247 |
| 27 | Ramanathapuram | 4 | 11,29,733 | 5,59,525 | 5,70,152 | 56 |
| 28 | Thoothukudi | 6 | 13,88,186 | 6,77,004 | 7,10,981 | 201 |
| 29 | Tirunelveli | 5 | 12,65,302 | 6,16,911 | 6,48,245 | 146 |
| 30 | Kanniyakumari | 6 | 15,20,338 | 7,55,254 | 7,64,958 | 126 |
| 31 | Ariyalur | 2 | 5,26,392 | 2,60,565 | 2,65,799 | 28 |
| 32 | Tiruppur | 8 | 19,83,882 | 9,57,453 | 10,26,178 | 251 |
| 33 | Kallakurichi | 4 | 11,21,803 | 5,57,523 | 5,64,073 | 207 |
| 34 | Tenkasi | 5 | 12,72,940 | 6,22,003 | 6,50,767 | 170 |
| 35 | Chengalpattu | 7 | 23,06,814 | 11,25,181 | 11,79,246 | 387 |
| 36 | Tirupathur | 4 | 9,19,827 | 4,53,343 | 4,66,343 | 141 |
| 37 | Ranipet | 4 | 9,51,858 | 4,64,430 | 4,87,317 | 111 |
| 38 | Mayiladuthurai | 3 | 7,35,135 | 3,62,939 | 3,72,149 | 47 |
| STATE TOTAL | 234 | 5,73,43,291 | 2,80,38,658 | 2,93,04,905 | 7,728 | |
Alliance & Party Seat Breakdown
Seat-sharing structure for 234 Tamil Nadu Assembly constituencies
SPA / DMK+ Alliance
234 Seats ContestedNDA / ADMK+ Alliance
234 Seats ContestedTVK (Tamilaga Vettri Kazhagam)
234 Seats ContestedNTK (Naam Tamilar Katchi)
234 Seats ContestedAJPK – AIPTMMK Alliance
107 Seats ContestedOther Parties
190 Seats ContestedCandidate Gender & Age Data
Breakdown across 4,023 candidates — verified data
Gender Distribution — All Candidates
Total candidates: 4,023 | Note: Female voters (51.1%) outnumber female candidates (11.0%)
Age Distribution — All Candidates
Average age: 46 years | Youngest: 25 years | Oldest: 87 years
Key Insights
Data-driven observations from the 2026 Tamil Nadu Assembly Election
2021 vs 2026 Comparison
Key changes between the previous and current Tamil Nadu Assembly elections
Frequently Asked Questions
Everything you need to know about the Tamil Nadu Assembly Election 2026.
-
1. When is the counting of votes for Tamil Nadu Election 2026?
The counting of votes for the 2026 Tamil Nadu Assembly Election is scheduled for May 4, 2026. Counting begins at 8:00 AM and results are expected to be declared by the evening. -
2. What was the voter turnout in Tamil Nadu Election 2026?
The approximate voter turnout for the 2026 Tamil Nadu Assembly Election was 85.15%, translating to approximately 4,88,28,832 voters polled out of 5,73,43,291 registered electors. This is a significant increase from the 72.7% turnout recorded in 2021. -
3. How many seats are there in Tamil Nadu Assembly?
The Tamil Nadu Legislative Assembly has 234 seats (assembly constituencies). To form a majority government, a party or alliance needs to win at least 118 seats. -
4. Which parties are in the SPA / DMK+ Alliance?
The SPA / DMK+ Alliance includes: DMK (176 seats, led by M.K. Stalin), INC (28 seats), DMDK (10 seats, Premalatha Vijayakant), VCK (8 seats, Thol. Thirumavalavan), CPI (5 seats), CPI(M) (5 seats), and IUML (2 seats). Total: 234 seats contested. -
5. Which parties are in the NDA / ADMK+ Alliance?
The NDA / ADMK+ Alliance includes: AIADMK (172 seats, led by Edappadi K. Palaniswami), BJP (33 seats, Nainar Nagendran), PMK (18 seats, Anbumani Ramadoss), and AMMK (11 seats, T.T.V. Dhinakaran). Total: 234 seats contested. -
6. What is TVK and who leads it in the 2026 election?
TVK (Tamilaga Vettri Kazhagam) is a political party led by actor-turned-politician Vijay. In the 2026 Tamil Nadu election, TVK contested 233 of the 234 seats and supported 1 independent candidate (Prem Kumar). -
7. How many female candidates contested in Tamil Nadu 2026?
Out of 4,023 total candidates, 442 female candidates contested, representing 11.0% of all candidates. There was also 1 third-gender candidate. Despite female voters outnumbering male voters in the electorate (51.1% vs 48.9%), female candidate representation remains low. -
8. Which constituency had the highest and lowest voter turnout?
The highest turnout was recorded jointly in Veerapandi and Karur at 93.4%, followed by Kulithalai at 92.8%. The lowest turnout was in Palayamkottai at 69.0%, followed by Killiyoor at 71.3% and Madurai North at 72.6%. -
9. How many new / first-time voters registered for Tamil Nadu 2026?
14.59 lakh (1,459,000) first-time voters registered for the 2026 Tamil Nadu Assembly Election. Additionally, 1.22 crore youth voters in the 18–29 age group make up 21.2% of the total electorate. -
10. What is the polling date for Tamil Nadu Assembly Election 2026?
The polling (voting) date for the 2026 Tamil Nadu Assembly Election was April 23, 2026. The counting of votes is on May 4, 2026, with election completion expected by May 6, 2026.
Moreover, the Tamil Nadu Election Results 2026 highlight significant changes compared to previous elections. In addition, voter turnout has increased sharply, while candidate diversity continues to evolve. Therefore, these insights help provide a clearer understanding of political trends across the state.
Tamil Nadu Election Results 2026 Winners List
Detailed constituency-wise winners will be updated after official results declaration.
You can also explore more updates on our homepage:
👉 https://makkalchoice.com
For official election updates, visit:
👉 https://eci.gov.in
Makkal Choice Exit Poll
👉https://makkalchoice.com/tamil-nadu-exit-poll-2026/
Last updated on: May 5, 2026